yFiles Graphs for Jupyter
![]()
![]()
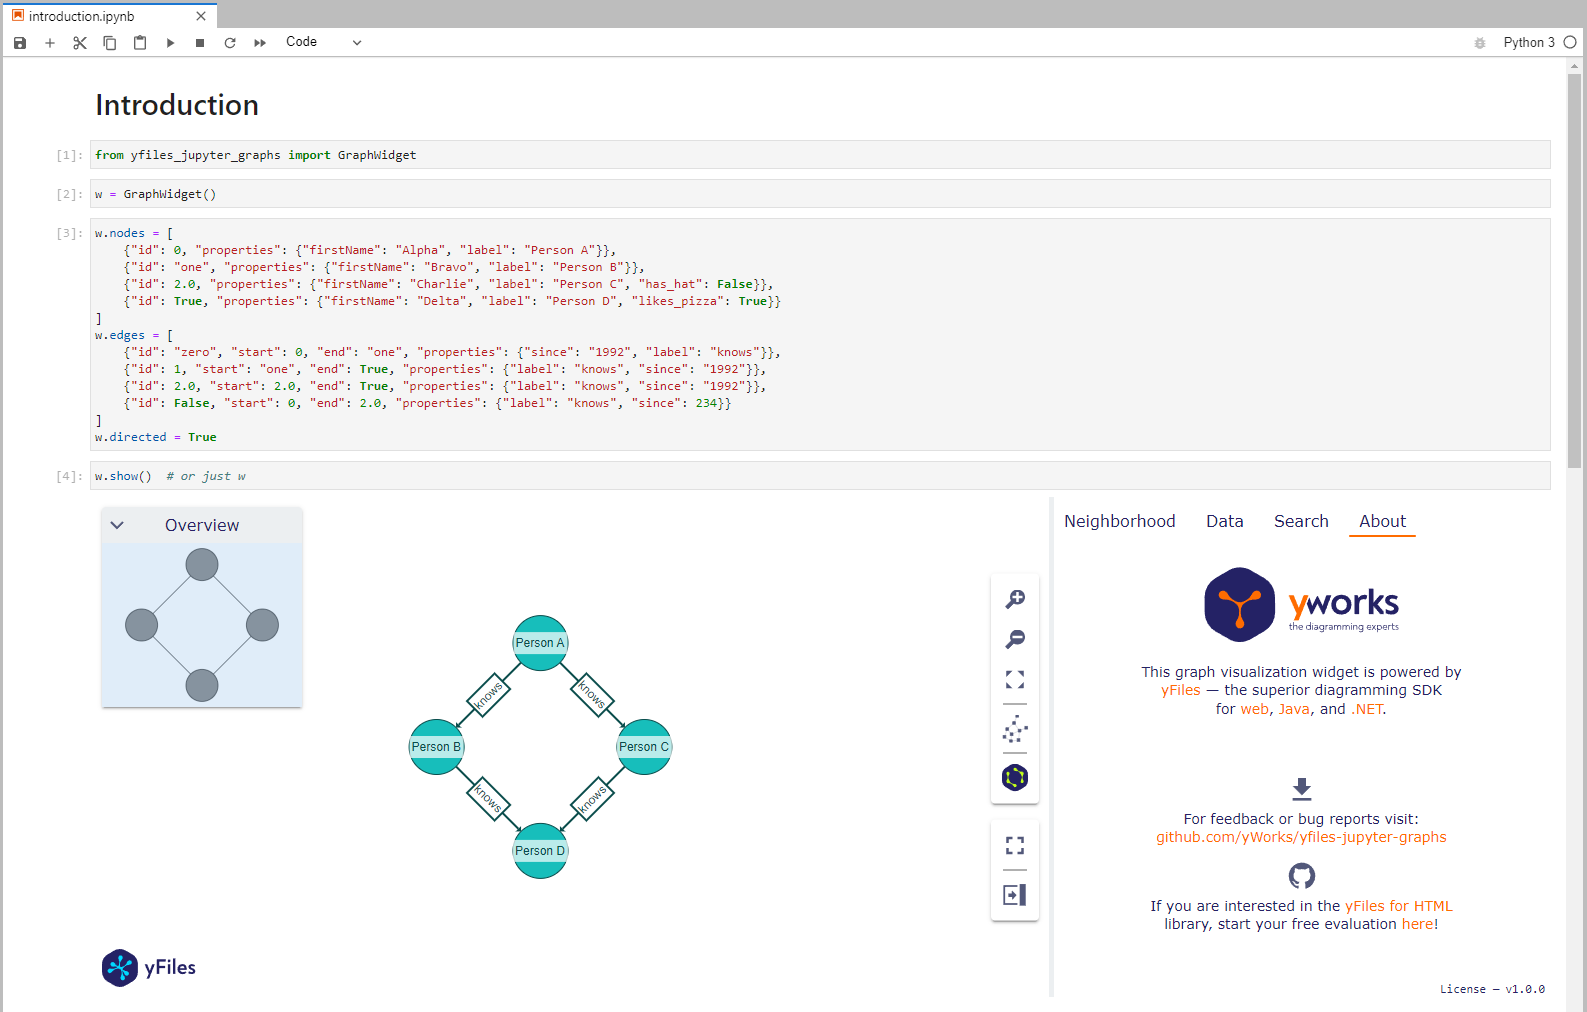
A graph diagram visualization widget for Jupyter Notebooks and Labs powered by yFiles for HTML.
yfiles-jupyter-graphs-for-neo4j
For working with Neo4j databases, we
built yfiles-jupyter-graphs-for-neo4j, an open-source
extension on top of yfiles-jupyter-graphs. This extension provides an easier Python interface for the
driver and allows direct configuration of data mappings depending on the label or type of the node or relationship.
yfiles-jupyter-graphs-for-sparql
For working with RDF databases and SPARQL queries, we built
yfiles-jupyter-graphs-for-sparql, an open-source
extension on top of yfiles-jupyter-graphs. This extension provides a specifically tailored API for easier and more
domain specific usage in RDF databases with SPARQL.
So if you are planning to use the extension with Neo4j databases, consider using yfiles-jupyter-graphs-for-neo4j.
Supported Environments
- JupyterLab or Jupyter Notebook
- Visual Studio Code
- Google Colaboratory
- Google Vertex AI Workbench
- Google Dataproc
- Azure Machine Learning Studio Notebooks
- Amazon SageMaker
- Kaggle
- Just try it in your preferred platform for Jupyter notebooks
Features


For example code look here.
Code of Conduct
This project and everyone participating in it is governed by the Code of Conduct. By participating, you are expected to uphold this code. Please report unacceptable behavior to contact@yworks.com.
Feedback
This widget is by no means perfect. If you find something is not working as expected we are glad to receive an issue report from you. Please make sure to search for existing issues first and check if the issue is not an unsupported feature or known issue. If you did not find anything related, report a new issue with necessary information. Please also provide a clear and descriptive title and stick to the issue templates. See issues.
Dependencies
License
See LICENSE file.